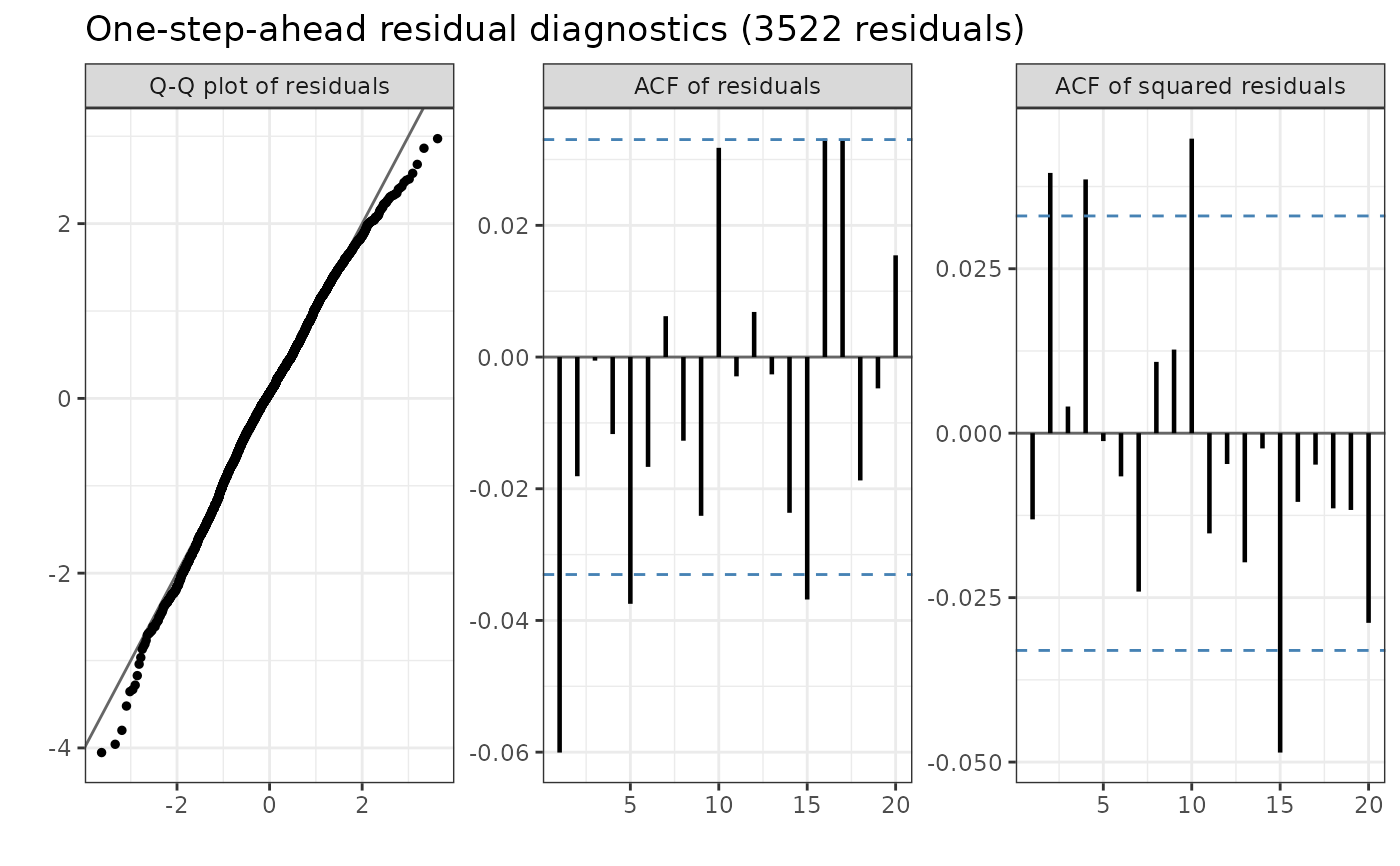
Shows three panels that check if the fitted model describes the data:
A Q-Q plot of the one-step-ahead (OSA) residuals against the standard gaussian distribution. If the model is correct, the points follow the diagonal. Bent tails show that the error distribution is wrong, for example that the returns have heavier tails or more skewness than the model allows.
The autocorrelation function (ACF) of the residuals. Bars outside the dashed lines show dependence in the returns that the model does not capture.
The ACF of the squared residuals. Bars outside the dashed lines show volatility clustering that the model does not capture.
Arguments
- x
A
stochvolTMBobject returned fromestimate_parameters.- res
Optional vector of OSA residuals from
residuals. IfNULL, the residuals are calculated.- lag_max
Maximum lag in the ACF panels.
- ...
Arguments passed to
residualswhenresisNULL, for examplemethodorconditional.
Details
By default, the residuals are calculated for all observations with the exact grid method of
residuals, which takes a few seconds. To reuse residuals, calculate them once with
residuals and give them in res.
Examples
# \donttest{
data(spy)
opt <- estimate_parameters(spy$log_return, model = "t", silent = TRUE)
plot_diagnostics(opt)
 # }