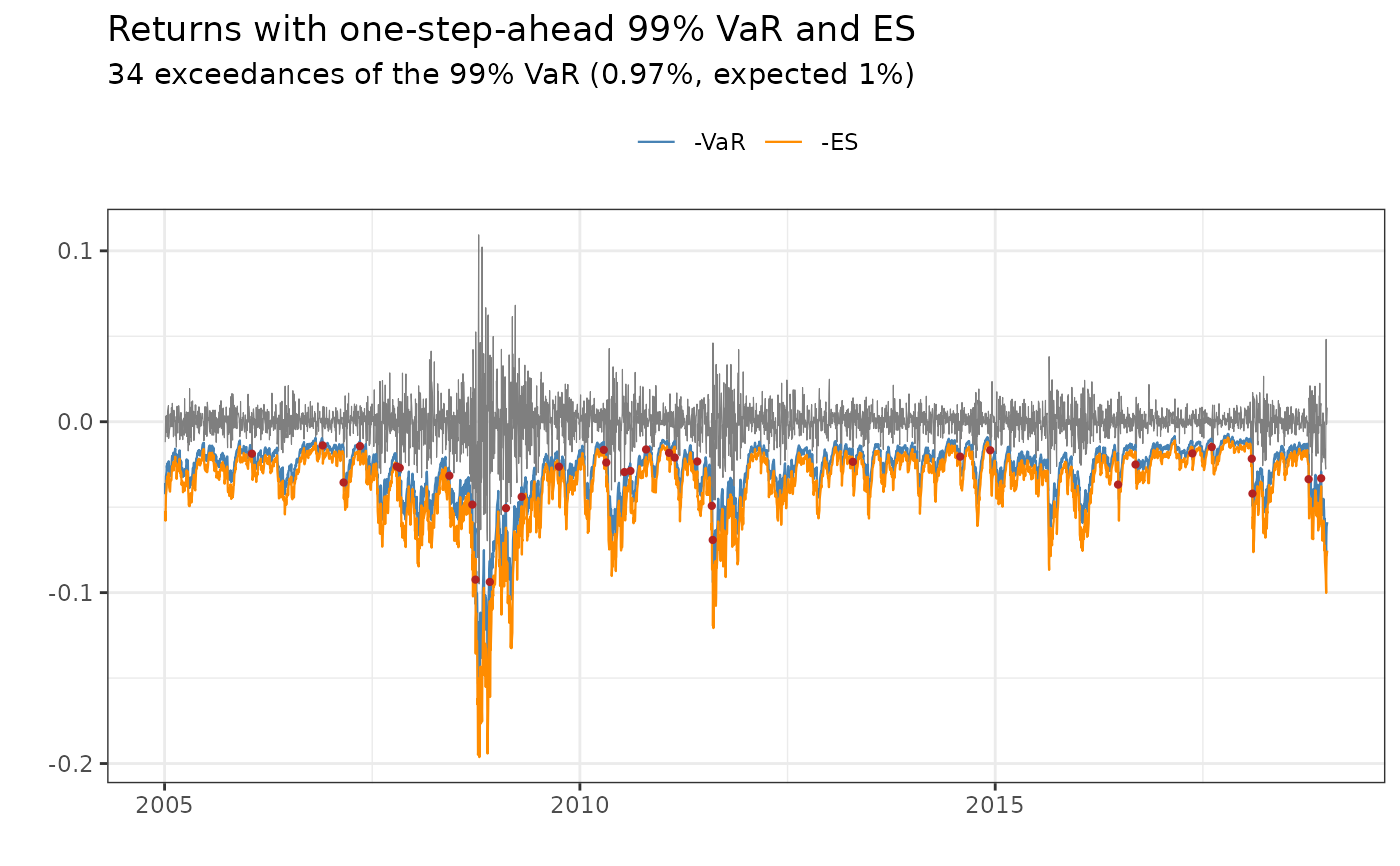
Plots the returns with -VaR and -ES from var_es and marks the exceedances, the
returns below -VaR.
Arguments
- x
A
data.tablereturned fromvar_es.- level
The level to plot. The default is the largest level in
x.- dates
Optional vector of dates with one element for each observed return, used for the x-axis.
Examples
# \donttest{
opt <- estimate_parameters(spy$log_return, model = "skew_t_leverage", silent = TRUE)
plot_var(var_es(opt, level = 0.99), dates = spy$date)
 # }