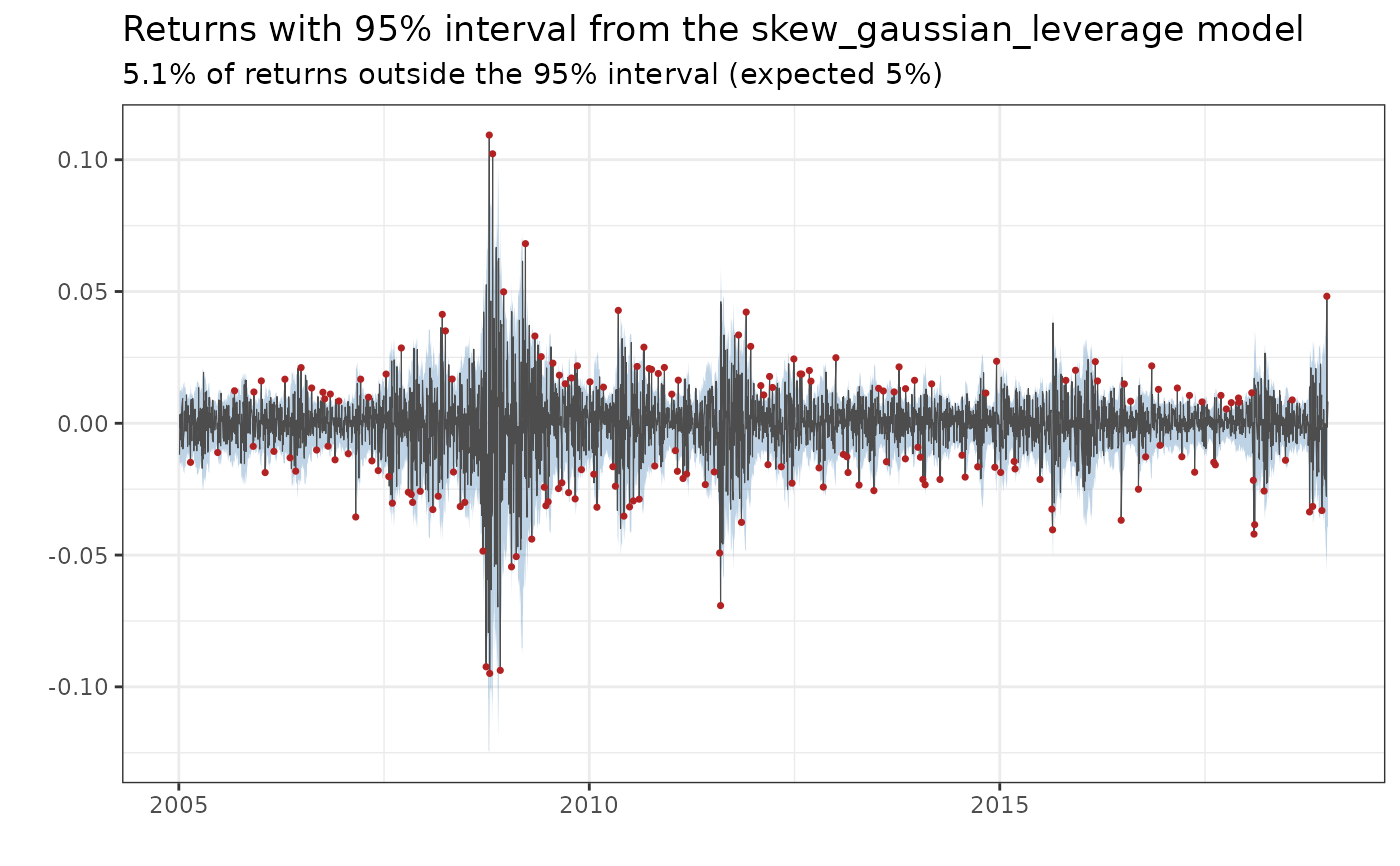
Plots the observed returns together with the central level interval of the fitted conditional
distribution of each return, given the estimated log-volatility h_t. The interval uses the error
distribution of the model, so it is asymmetric for the skew gaussian models and wider for the t model.
Returns outside the interval are marked in red.
Arguments
- x
A
stochvolTMBobject returned fromestimate_parameters.- level
Probability covered by the interval.
- dates
Vector of length
x$nobs, providing optional dates for labeling the x-axis. The default value isNULL; in this case, the axis will be labeled with numbers.
Details
The subtitle shows the share of returns outside the interval. For a good model it is close to
1 - level. The bands use the smoothed estimate of h_t, which also uses y_t. The share is
therefore an optimistic, in-sample check. Use plot_diagnostics for a check based on
one-step-ahead residuals.
Examples
# \donttest{
data(spy)
opt <- estimate_parameters(spy$log_return, model = "skew_gaussian_leverage", silent = TRUE)
plot_returns(opt, dates = spy$date)
 # }